Image Calendar Generator

Note : This project was done in 2007. So some of the code needs to be explored to explain.

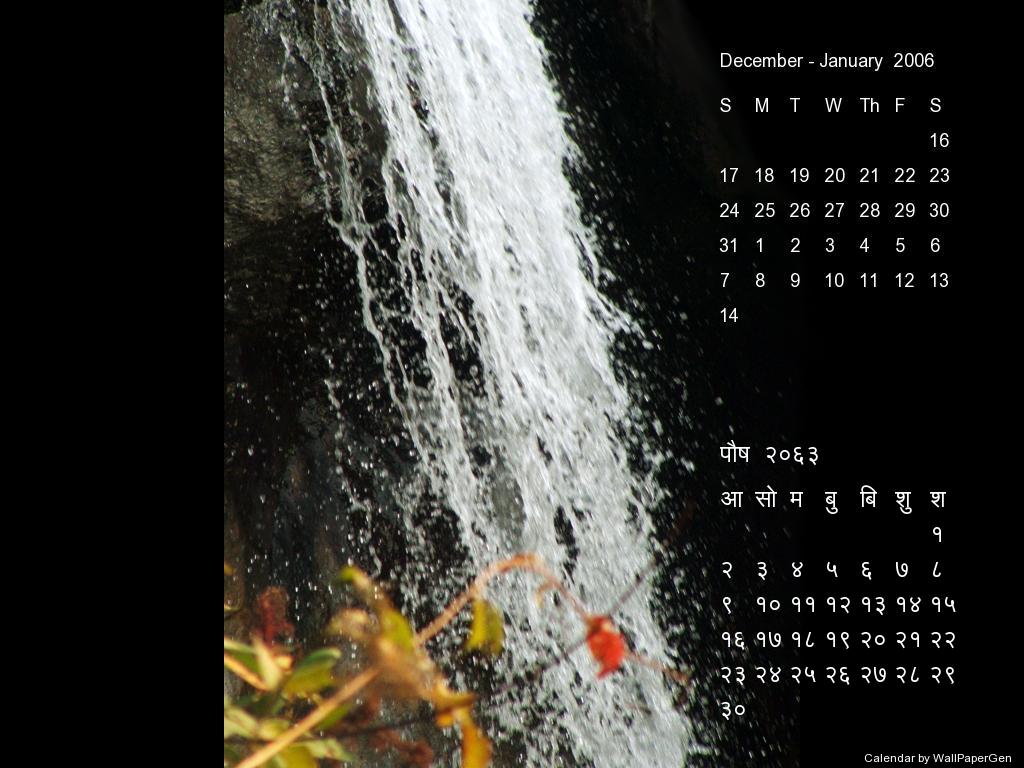
I wanted to take images like below:

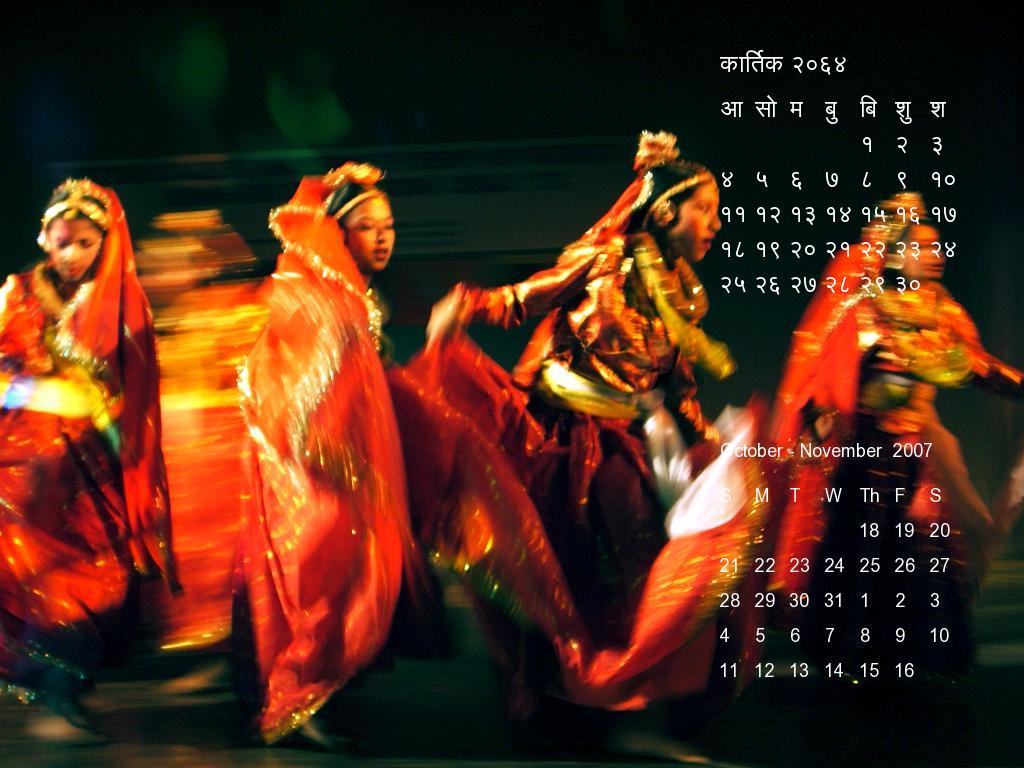
And add Nepali and English calendars to them like below so that I could use them as my wallpaper as well as a calendar — Something like a desk calendar.

I created a Python app to do this and below is how the setup screen looks.

The application can be started from the command-line like below :

>>python wallPapergen.py

Once all parameters are setup in the setup screen I could generate the calendars on top of images using the famed Python PIL (Python Imaging Library) library.

Setup screen for the Calendar on Image generator

There is a quick help as to what each of these parameters are on the top right corner shown with a question mark icon.

Few parameters worth talking about it are:

Colors : we can select among a variety of colors. I think the idea was to choose colors that standout the most in the images for the calendar/s to be visible.

Direction : total of 9 directions are available to place the calendar on images. These 9 directions are all around the corners and one at the center.

Date Format : this is the confusing one. I don’t even remember why I put it there. What it does is either generate the Nepali calendar first and generate English calendar based on the Nepali calendar or vice versa.

Other options are pretty self-explanatory.

The three core files to this code are:

createCalendarPicture.py : this contains the core methods that take the picture, get calendar data from dateConverter.py and put the calendar as image onto the picture

dateConverter.py : does the date conversion between Nepali dates and English dates

dateData.py : this is the Nepali Calendar database with Year and days of the month. Nepali months can have anywhere between 28 to 32 days.

Note : This code was designed for a 1024×768 screen size.

Full code for the Wall Paper Calendar generator — http://www.prjoshi.com/wp-content/uploads/2020/01/calendar_code.zip

The Marks Distributor

Note : You really don’t want to use this software. It is a system designed for research purposes and looking at working of codes for automated data generation.

While teaching some subjects at the Master’s level, I realized that most often marks are not exactly what determines the students. In this case the marks were just arbitrary numbers we assigned to exams based on their everyday performance as well as their experiences relative to the field of study.

So I got the urge to write a program that would arbitrarily assign marks to questions then adds all that up to get to a pre-determined total. This program was created over a day of not finding anything to do and wanting to test out how believable enough a random marks assigner would be.

Let me start with the result (output) of the code that will given a little later and talk about the result.

1 -> [10, 5]
2 -> [5, 10]
3 -> [3]
4 -> [5]
5 -> [5]
6 -> [5]
7 -> [5]
8 -> [8]
9 -> [6]
10 -> [7]
11 -> [5, 5, 5, 5]

[10, 5, 5, 10, 3, 5, 5, 5, 5, 8, 6, 7, 5, 5, 5, 5] 94

From the above, it states that Question 1 had 2 sub-questions, 1 of 10 marks and other of 5 marks. If one looks at question 11, then there are 4 sub-questions of 5 marks each.

The paper is supposed to be marked for a total of 94. [10, 5, 5, 10, 3, 5, 5, 5, 5, 8, 6, 7, 5, 5, 5, 5] is the marks assignment that the software comes up with to get to the 94.

Below is code in its entirety. All code was written in Python 2.7 on Linux Mint.

import random

def generateMarksList():
    givenFullMarks = 94
    marksDispersal = [[10, 5], [5, 10], [6], [5], [5], [6], [6], [8], [6], [8], [5, 5, 5, 5]]
    marksAssign = [1, 2, 3]
    marksBlock = [2, 2, 1, 1, 1, 1, 1, 1, 1, 1, 4]
    marksDispersal = sum(marksDispersal, [])
    finalAssign = []
    if sum(marksDispersal) > givenFullMarks: 
        while sum(marksAssign) != givenFullMarks:
            marksAssign = []
            for i in marksDispersal:
                if i != 0:
                    marksAssign.append(random.randint(int(0.6 * i), i))
                else:
                    marksAssign.append(i)
    else:
        marks = "Marks dispersal is not above given full marks"
    startMarker = 0
    endMarker = 0
    for i in marksBlock:
        endMarker = endMarker + i
        tempList = marksAssign[startMarker: endMarker]
        finalAssign.append(tempList)
        startMarker = startMarker + i
    for i, j in enumerate(finalAssign):
        print i + 1, " -> ", j
    print "\n"
    print marksAssign, sum(marksAssign)

if __name__ == "__main__":
    generateMarksList()
    print "Demo!!!..."

The magic in this code happens in the generateMarksList function. Here marks are calculated per question and assigned to a finalAssign variable to get a total of the total marks assigned. This is a bruteforce method where marks start to go upwards from 0 to get to a value that will get the total to given one.

Each mark assigned is allowed to have some leeway in how the marks are assigned to not give full marks to questions if and when possible.

I later used this marks generator to create datasets for my student cluster generator, that has been posted as a blog here — http://www.prjoshi.com/?p=11

Nepali Units Converter

Python scripts that allow for conversion among legacy based local Nepali units of area, volume and weight to metric units and among themselves and vice versa.

The formulas used if obtained from Nepal Rastra Bank, Agriculture Survey Report, 1972 where the formula is given comprehensively.

These set of scripts are created as an archive of the formula as no other comprehensive conversion script seem available.

These formulas have been used in agriculture related applications.

How it is arranged :

  • formulas.py — all weights that are required for conversion
  • areaConverter.py — formulas for area conversion
  • volumeConverter.py — formulas for volume conversion
  • weightConverter.py — formulas for weight conversion

The scripts to use the formulas :

  • nepaliUnitConverter.py — commandline script to convert
  • converter.py — a basic wx based gui for conversions

Usage :

One can either edit the nepaliUnitConverter.py file, make necessary changes to the following code at the bottom of the file:
localUnit = “MuriMato”
metricUnit = “Hectares”
valueToBeConverted = 1
fromTo = “Metric To Local” #can be Metric to Local, Local to Metric
currentUnits = “area” #can be Area, Weight or Volume
and run the script

or

one can run the GUI and do the conversions there

The formulas and the conversions that have been inplemented are below:

multiplying factors

Area measurements

Local area to metric area

muriMatoToHectares = 0.0127
pathiMatoToHectares = 0.0006
ropaniToHectares = 0.0509
bighaToHectares = 0.6800
annaToHectares = 0.0032
dhurToHectares = 0.0017
kathaToHectares = 0.0338

to smaller units in local area

muriMatoToPathiMato = 20
pathiMatoToManaMato = 8
ropaniToAnna = 16
bighaToKatha = 20
kathaToDhur = 20

Weight and volume measurements

Local Weights to metric Weights

maundToKilograms = 37.3240
dharniToKilograms = 2.3325
sheerToKilograms = 0.9331
pausToKilograms = 0.1944

to smaller weights in local weights

maundToSheers = 40
dharniToPaus = 12

Local volume to metric Weights

muriPaddyToKilograms = 50.00
muriWheatToKilograms = 67.30
muriMaizeToKilograms = 62.70
muriMilletToKilograms = 67.30

pathiPaddyToKilograms = 2.5000
pathiMaizeToKilograms = 3.1350
pathiWheatToKilgrams = 3.3650
pathiMilletToKilograms = 3.3650

to smaller volume in local volumes

muriToPathi = 20
pathiToMana = 8

DISCLAIMER

I have not put too much effort into this to be used as a working application, rather worked on it on the part of preserving the formulas and the weights as well as to provide a simple documentation of local units used for area, weight and volume. So the application itself is rusty for use.

Download Python Script here — http://www.prjoshi.com/wp-content/uploads/2019/12/NepaliUnitConverter.zip

Small Data Analysis using Exam data

Trying to analyze marks obtained by students in exams and getting something meaningful out of it has been something that I had planned on working for a long time.

The reason for not jumping in was mainly around what tools I would use to do the analysis. Though conventional statistics could provide most of what I was looking to, I wanted to go a little further and look into ways of categorizing students to find topics that should be repeated to them.

Having gone though a bit of Decision trees and K Means clustering I decided to use these and see how they work in small datasets. *A sample dataset is added at the end of the article.

The dataset is for a particular exam paper (this being Physics). It consists of marks obtained by students in each of the questions, the total and a grade that is given for a range of totals.

To make it simple for analysis I normalized the scores to 0 and 1. This had to be done as the highest score for individual questions varied.

First off I created a box and whisker plot of the marks.

Block and Whisker plot for student data

This should variation in marks for Q4, Q8 are very wide while those for Q0, Q5, A13 and Q14 are narrow — meaning students scored near each other for Q0, Q5, A13 and Q14.

To find out questions that really changed the scores for the students, I created a decision tree.

Decision tree for the marks analysis

This Decision tree gives the questions that groups of students either scored high in or scored low in. If we follow the tree along the left most path, one finds that many students (12 out of 34) have done badly in question number 7. Also ones who have done well in questions Q7 have also done well in question 5. At the top of the tree the students who have not done well in Q6, seem have not done well in most of the questions.

Having learned this I set out to build a K mean cluster to see the students group based on the marks they scored. Below is the cluster visualization.

The cluster with the red dots show students that are faring along well compared to others in all questions. The ones in yellow are not faring along well and need attention in all questions. If one goes back to the Decision tree the yellow dot group did really badly in Q6, Q1 and Q7 thereby moving towards the left end of the K means cluster.

This is starting of data analysis tool for students data. The thought behind this is that in Nepal and countries around it, large scale exams will happen and we need to find ways to analyze this data to provide education opportunity to students based on how they are faring in them.

Zip file of code and sample data — http://www.prjoshi.com/wp-content/uploads/2019/12/BVS_marksAnalyzer.zip